
Newest St. Louis Housing Report
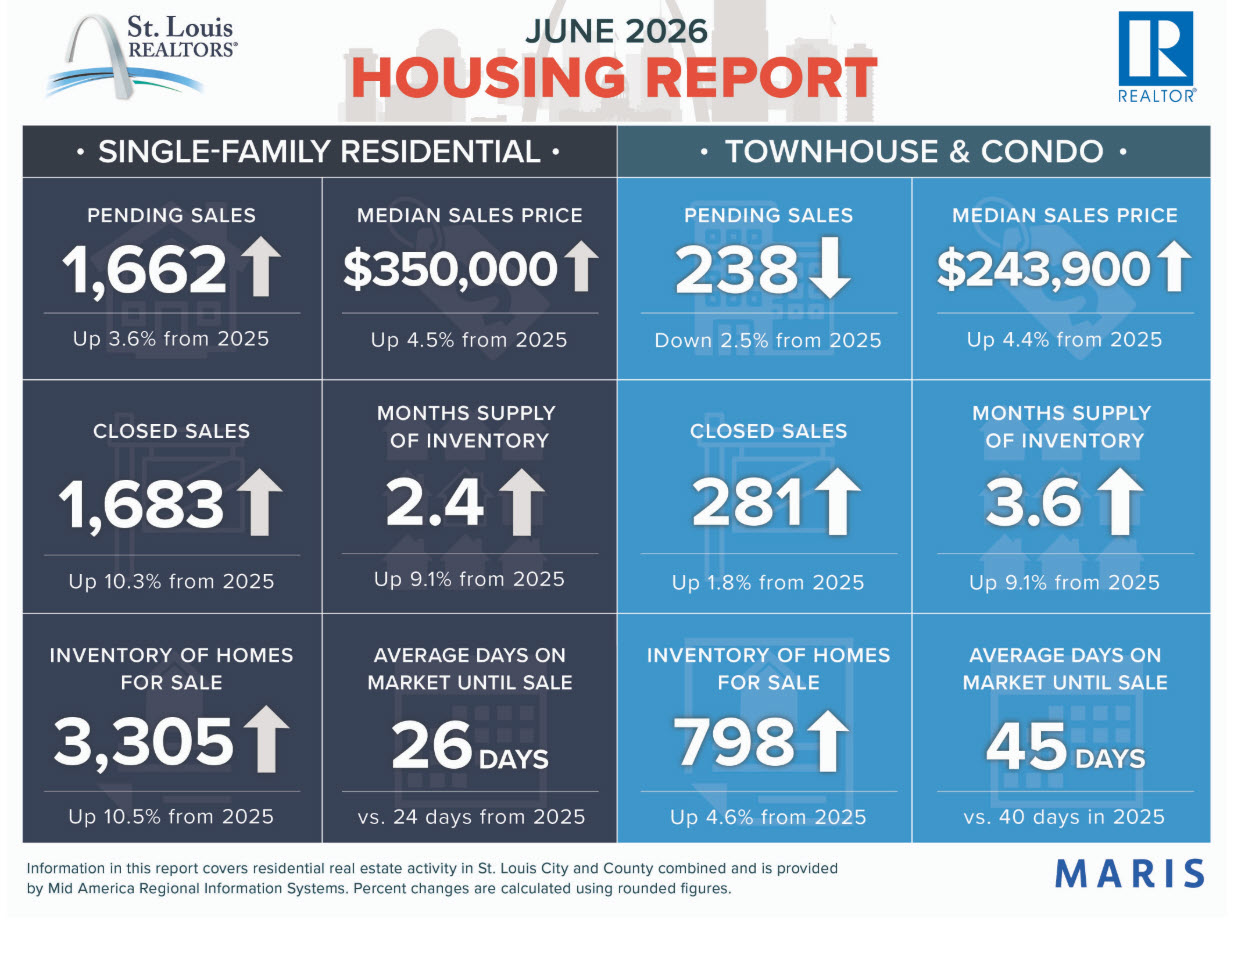
These figures compare real estate activity in June 2026 to July 2025
Data Source: St Louis Realtors
Big picture
In June 2026, the St. Louis REALTORS®/MARIS area stayed a strong seller’s market, with more activity, higher prices, a bit more inventory, and slightly longer days on market.
Local market snapshot
-
New listings up 8% for single-family homes, down slightly (1.4%) for townhome/condo.
-
Pending and closed sales increased overall, showing solid buyer demand.
-
Prices rose: about 4.5% to $350,000 for median for single-family homes and rose (4.4%) $243,900 for townhome/condos in June.
-
Days on market ticked up, but homes still sell quickly, often at or above list price.
-
Inventory and months’ supply increased, yet remain below “balanced” levels, favoring sellers.
-
Affordability slipped compared with last year, especially for single-family, while condos/townhomes remain relatively more affordable.
Whether You're a Buyer or Seller We Have Free Guides to Read or Download Your Own Copy Here
Quick Lesson and Deeper Dive
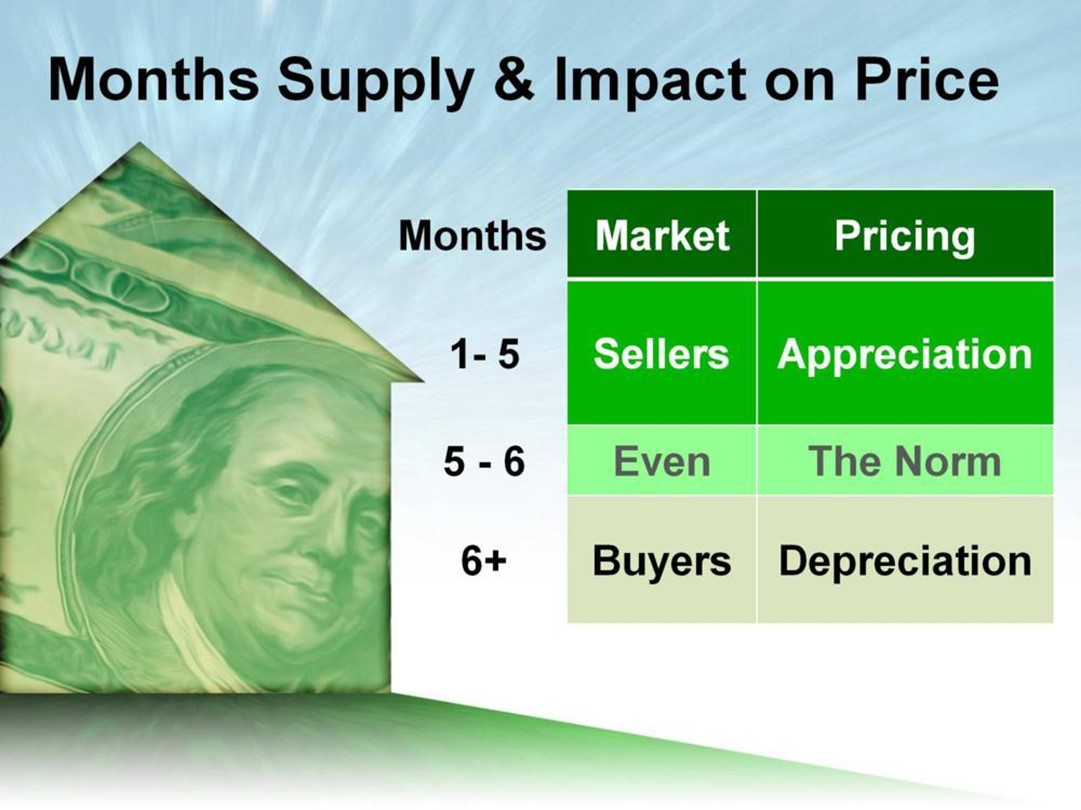
How to Understand the Law of Supply and Demand in Real Estate
It's simpler than you might think.
-
Calculation: It's calculated by dividing the current number of active listings by the average sales per month.
-
Low Inventory: If this number is low (e.g., 1-3 months), it means there are fewer homes for sale relative to buyer demand. This situation typically indicates a seller's market.
-
High Inventory: A higher number (e.g., 6 months or more) suggests there are many homes available compared to the number of buyers, indicating a buyer's market.
Below are the current months of supply for St. Louis and St. Charles County as of 7/20/2026
St. Louis County 2.05 Months of Inventory
St. Charles County 2.13 Months of Inventory
Whether you're interested in the St. Louis or St. Charles area, the supply of homes is still low.
That's why home prices keep going up and why competition is still very much in the picture.
Will Home Prices Start to Go Down?
Too soon to tell. This will depend on the area you are interested in. We do have a quick way for you to see homes that have recently lowered their price.
Check out our easy-to-use hack the Price Checker.
Want to see homes that have lowered their price in the last 3 days, 7 days, or in the past month? We've got you covered!
Click on over to our Price Checker for some DIY research! (We included a tutorial for you once you get there)

Attention Data Geeks and Chart Lovers Keep Scrolling for More
The charts below will show you month by month over the past 5 years how many new listings came on the market on a monthly basis.
If you put your mouse over the graph lines you will see the actual numbers and how they change month to month. This data is refreshed continuously so mark this page and come back in the future to see the trends.
St. Louis County New Listings-Over the Last 5 Years
St. Louis County Median Sold Price Over the Last 5 Years
St. Louis County Median Days on Market (how long it took to sell)
The Last 5 Years
St. Charles County Data You Should Know
St. Charles County New Listings Over the Last 5 Years
St. Charles Median Sold Price for 3 Bedroom Homes Over the Past 5 Years
St. Charles Median Days on Market-How Long it Took to Sell
Links to More Communities for Median Prices 5 Year Period
Ballwin
Chesterfield
Wildwood
Brentwood
Maplewood
University City
Ladue
Kirkwood
Central West End
Finding Homes for You Leads with Data
How can you know the trends and the pulse of any market without timely data? You can't. If you would like to know more about a particular market we can provide you with so much more. To get started just tell us the basic items you need as outlined in the image below:

We Will Send You These Reports
Median Sales Price
Days on Market
Percentage the Sellers are Getting for Home
Example: Looking for 4 bedroom home with 2+ bathrooms in Parkway School District
Just enter that in the box below and we will get back to you with your reports in the same day. Questions? Call 636-532-4200